As a data scientist, numbers do not scare me. In fact, I love numbers. When those numbers have a dollar signed attached to them, I love them even more. Money and data go hand-in-hand. In the business world, the best thing to keep track of finances is a profit and loss (P&L) chart. This is also known as the common accounting practice of job costing.
In 1992, I went to Bentley University for my MBA. I took Accounting I, Accounting II, Finance I, and Finance II. I learned a lot about finance but the one thing that we barely spent any time on was job costing. Most colleges only tell you that the sole purpose of accounting is to keep track of how much money you need to collect from people and how much money you have paid to those you owe. While that is important, there are other key ideas when it comes to tracking finances.
Most people who earn under $100,000 a year in revenue will take their bank statements and a bunch of spreadsheets in order to calculate their profits/losses. They would then go to their accountant with twelve months of bank statements and say, “here, tell me how much money I made and file my taxes please.” Regardless of the method, every business will go to an accountant and say here are my financials from the last twelve months, please prepare my tax returns and tell me how much I have to pay to Uncle Sam.
That typically happens between December and April. But, your accountant is swamped so what does he/she do? They file for an extension. Now it is September and the accountant calls you saying she is putting your paperwork together but needs to know what this $1,350 check made out to company X was for. You’re sitting there trying to rack your brain because that was sixteen months ago. Eventually, you guess. That backward guessing is how most people keep running their life and business.
Hopefully they grow out of that guessing nonsense but when they do, they will need a bookkeeper. The bookkeeper is going to do the data entry once a month. Unlike your accountant, who is more than a year behind you, your bookkeeper is only a month behind you. Everyone in that entire ecosystem -- the CPA, the bookkeeper, the accountant -- they all revolve around the idea of making sure you pay enough taxes so you don’t go to jail.
None of them take into consideration the money you need to run your business or how much it costs to pay all of your employees. Most people like to see their payday during the project but a lot of people do not know how much they spent on the project until they are done working.
Back in 2002, Microsoft Office was a very new thing. There was a Microsoft office template of an expense and income spreadsheet which helped to calculate profit and loss projection. That sheet was the start of the P&L charts that changed the way I ran my business and my life.
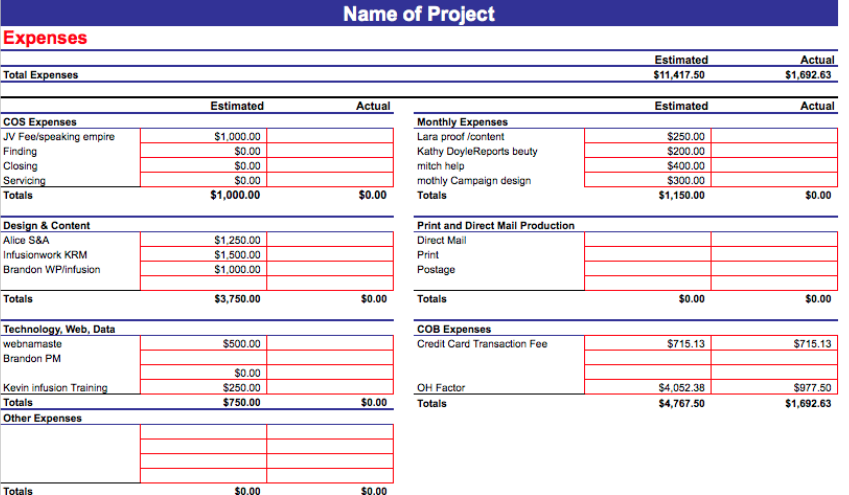
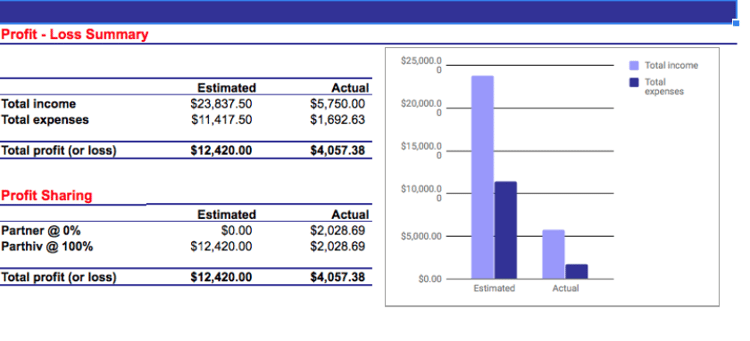
It’s very simple. The sheet has three main components. The first page has two columns, estimated and actual costs. The second sheet is actual and projected income. The third is expected and actual profits/losses. The purpose of the spreadsheet is to keep accurate accounts of revenues and actual cost. If you are reading this book would like my P&L template, send me an email at pshah@elaunchers.com and I will send it to you.
Before I created any of my own companies, I used to work for a car company. Once a month, I would get the P&L sheets printed out and placed in a binder. Then, I would thumb through each page. For each client, I would look at the graph. I would watch the graph move almost like it was a flipbook. Anytime I saw a flicker, I would stop. A flicker means that either the revenue or the expenses were out-of-whack. If that happened, I would pull the folder that contained all the sales contracts and invoices that we paid for that particular project.
If my folder and graph told me to, I would call the vendors. If the folder and graph told me to, I would call the salespeople. Sometimes, the vendors were right, other times the sales people took a short deal. Looking at the P&L sheets every month helped me control everyone’s behavior and ensured that we were making money where we were supposed to be making. THAT is job costing.
Fast forward to 2017 and I have brought this concept to my own company, eLaunchers. Any time we get a new client or a deal the first thing we do is build out the P&L spreadsheet for the project. We will have an estimated column and as the money comes in, we will input the actual received. Calculate your money to the fourth decimal of expected revenue, expected profits, and expected expenses. Compare that to actual revenue, actual profits, and actual expenses. Let THAT be your guide as you are managing relationships with your people.
I want to know can I afford to pay $20,000 to go to a networking conference next year. I want to know can I afford to pay someone $7,000 in JVC if they bring me a $45000 deal. I want to know if I can add some extra copy for free to a long-standing and loyal client if he/she asks for it. My ever-revolving P&L spreadsheet feeds me the data that QuickBooks does not. They are both based on cash but my P&L talks about a moving data from a completely different vantage point.
LivePlan is another tool that I use in conjunction with my P&L spreadsheets. It basically gives me a holistic projected P&L of the company. Along with the actual revenue and expense, LivePlan gives you a healthy industry benchmark to compare your data to. As long as your accounts are in alignment with the accounts in LivePlan, you will be able to keep track of what is happening on a daily, weekly, monthly, quarterly, and annual level holistically for the company. Your P&L spreadsheet will help you keep track of what is happening to the health of each project on a daily, weekly, monthly, quarterly and annual basis.
To sum up this post, I want to ask the question: what is a millionaire? Is a millionaire someone who makes a million or someone who has a million. If you were unsure, the answer is someone who has a million. You have to be able to make a million dollars and NOT spend it. In order to have a million, you need to have made a few dollars, spent a few dollars, and saved a million dollars. Project P&L will help you keep track of your journey towards becoming a millionaire.
What should be your financial model? Do you calculate revenue minus expenses in order to determine profit? Or do you use revenue minus profit in order to determine the expenses which you later tell the rest of your ecosystem to balance their budget from the money that you put on the table. Many business owners pay attention to cash but they don’t pay attention to their their fiscal fitness. Running a business with the latter method is a dangerous proposition as it is like eating the infamous donut from the earlier chapter.
You work hard to earn the revenue and you work hard to manage the expenses, my advice to you is to do more with your numbers than just keeping track of them. Take these tools and keep track of your numbers. Do not let your company suffer for something as simple as keeping track of some numbers, implement P&L sheets.